75d24c15
 yangbin
123 yangbin
123
|
1
2
3
4
5
6
7
8
9
10
11
12
13
14
15
16
17
18
19
20
21
22
23
24
25
26
27
28
29
30
31
32
33
34
35
36
37
38
39
40
41
42
43
44
45
46
47
48
49
50
51
52
53
54
55
56
57
58
59
60
61
62
63
64
65
66
67
68
69
70
71
72
73
74
75
76
77
78
79
80
81
82
83
84
85
86
87
88
89
90
91
92
93
94
95
96
97
98
99
100
101
102
103
104
105
106
107
108
109
110
111
112
113
114
115
116
117
118
119
120
121
122
123
124
125
126
127
128
129
130
131
132
133
134
135
136
137
138
139
140
141
142
143
144
145
146
147
148
149
150
151
152
153
154
155
156
157
158
159
160
161
162
163
164
165
166
167
168
169
170
171
172
173
174
175
176
177
178
179
180
181
182
183
184
185
186
187
188
189
190
191
192
193
194
195
196
197
198
199
200
201
202
203
204
205
206
207
208
209
210
211
212
213
214
215
216
217
218
219
220
221
222
223
224
225
226
227
|
**Version 3.5.0**, synced to [MPAndroidChart #f6a398b](https://github.com/PhilJay/MPAndroidChart/commit/f6a398b)

 [](https://github.com/danielgindi/Charts/releases) [](http://cocoapods.org/pods/charts) [](https://github.com/Carthage/Carthage) [](https://travis-ci.org/danielgindi/Charts) [](https://codecov.io/gh/danielgindi/Charts)
[](https://gitter.im/danielgindi/Charts?utm_source=badge&utm_medium=badge&utm_campaign=pr-badge&utm_content=badge)
### Just a heads up: Charts 3.0 has some breaking changes. Please read [the release/migration notes](https://github.com/danielgindi/Charts/releases/tag/v3.0.0).
### Another heads up: ChartsRealm is now in a [separate repo](https://github.com/danielgindi/ChartsRealm). Pods is also now `Charts` and `ChartsRealm`, instead of ~`Charts/Core`~ and ~`Charts/Realm`~
### One more heads up: As Swift evolves, if you are not using the latest Swift compiler, you shouldn't check out the master branch. Instead, you should go to the release page and pick up whatever suits you.
* Xcode 11 / Swift 5 (master branch)
* iOS >= 8.0 (Use as an **Embedded** Framework)
* tvOS >= 9.0
* macOS >= 10.11
Okay so there's this beautiful library called [MPAndroidChart](https://github.com/PhilJay/MPAndroidChart) by [Philipp Jahoda](https://www.linkedin.com/in/philippjahoda) which has become very popular amongst Android developers, but there was no decent solution to create charts for iOS.
I've chosen to write it in `Swift` as it can be highly optimized by the compiler, and can be used in both `Swift` and `ObjC` project. The demo project is written in `ObjC` to demonstrate how it works.
**An amazing feature** of this library now, for Android, iOS, tvOS and macOS, is the time it saves you when developing for both platforms, as the learning curve is singleton- it happens only once, and the code stays very similar so developers don't have to go around and re-invent the app to produce the same output with a different library. (And that's not even considering the fact that there's not really another good choice out there currently...)
## Having trouble running the demo?
* `ChartsDemo/ChartsDemo.xcodeproj` is the demo project for iOS/tvOS
* `ChartsDemo-OSX/ChartsDemo-OSX.xcodeproj` is the demo project for macOS
* Make sure you are running a supported version of Xcode.
* Usually it is specified here a few lines above.
* In most cases it will be the latest Xcode version.
* Make sure that your project supports Swift 5.0
* Optional: Run `carthage checkout` in the project folder, to fetch dependencies (i.e testing dependencies).
* If you don't have Carthage - you can get it [here](https://github.com/Carthage/Carthage/releases).
## Usage
In order to correctly compile:
1. Drag the `Charts.xcodeproj` to your project
2. Go to your target's settings, hit the "+" under the "Embedded Binaries" section, and select the Charts.framework
3. `@import Charts`
4. When using Swift in an ObjC project:
- You need to import your Bridging Header. Usually it is "*YourProject-Swift.h*", so in ChartsDemo it's "*ChartsDemo-Swift.h*". Do not try to actually include "*ChartsDemo-Swift.h*" in your project :-)
- (Xcode 8.1 and earlier) Under "Build Options", mark "Embedded Content Contains Swift Code"
- (Xcode 8.2+) Under "Build Options", mark "Always Embed Swift Standard Libraries"
5. When using [Realm.io](https://realm.io/):
- Note that the Realm framework is not linked with Charts - it is only there for *optional* bindings. Which means that you need to have the framework in your project, and in a compatible version to whatever is compiled with Charts. We will do our best to always compile against the latest version.
- You'll need to add `ChartsRealm` as a dependency too.
## 3rd party tutorials
#### Video tutorials
* [Chart in Swift - Setting Up a Basic Line Chart Using iOS Charts(Alex Nagy)](https://www.youtube.com/watch?v=mWhwe_tLNE8&list=PL_csAAO9PQ8bjzg-wxEff1Fr0Y5W1hrum&index=5)
#### Blog posts
* [Using Realm and Charts with Swift 3 in iOS 10 (Sami Korpela)](https://medium.com/@skoli/using-realm-and-charts-with-swift-3-in-ios-10-40c42e3838c0#.2gyymwfh8)
* [Creating a Line Chart in Swift 3 and iOS 10 (Osian Smith)](https://medium.com/@OsianSmith/creating-a-line-chart-in-swift-3-and-ios-10-2f647c95392e)
* [Beginning Set-up and Example Using Charts with Swift 3](https://github.com/annalizhaz/ChartsForSwiftBasic)
* [Creating a Radar Chart in Swift (David Piper)](https://medium.com/@HeyDaveTheDev/creating-a-radar-chart-in-swift-5791afcf92f0)
* [Plotting in IOS using Charts framework with SwiftUI (Evgeny Basisty)](https://medium.com/@zzzzbh/plotting-in-ios-using-charts-framework-with-swiftui-222034a2bea6)
Want your tutorial to show here? Create a PR!
## Troubleshooting
#### Can't compile?
* Please note the difference between installing a compiled framework from CocoaPods or Carthage, and copying the source code.
* Please read the **Usage** section again.
* Search in the issues
* Try to politely ask in the issues section
#### Other problems / feature requests
* Search in the issues
* Try to politely ask in the issues section
## CocoaPods Install
Add `pod 'Charts'` to your Podfile. "Charts" is the name of the library.
For [Realm](https://realm.io/) support, please add `pod 'ChartsRealm'` too.
**Note:** ~~`pod 'ios-charts'`~~ is not the correct library, and refers to a different project by someone else.
## Carthage Install
Charts now include Carthage prebuilt binaries.
```carthage
github "danielgindi/Charts" == 3.5.0
github "danielgindi/Charts" ~> 3.5.0
```
In order to build the binaries for a new release, use `carthage build --no-skip-current && carthage archive Charts`.
## 3rd party bindings
Xamarin (by @Flash3001): *iOS* - [GitHub](https://github.com/Flash3001/iOSCharts.Xamarin)/[NuGet](https://www.nuget.org/packages/iOSCharts/). *Android* - [GitHub](https://github.com/Flash3001/MPAndroidChart.Xamarin)/[NuGet](https://www.nuget.org/packages/MPAndroidChart/).
## Help
If you like what you see here, and want to support the work being done in this repository, you could:
* Contribute code, issues and pull requests
* Let people know this library exists (:fire: spread the word :fire:)
* [](https://www.paypal.com/cgi-bin/webscr?cmd=_s-xclick&hosted_button_id=68UL6Y8KUPS96) (You can buy me a beer, or you can buy me dinner :-)
**Note:** The author of [MPAndroidChart](https://github.com/PhilJay/MPAndroidChart) is the reason that this library exists, and is accepting [donations](https://github.com/PhilJay/MPAndroidChart#donations) on his page. He deserves them!
Questions & Issues
-----
If you are having questions or problems, you should:
- Make sure you are using the latest version of the library. Check the [**release-section**](https://github.com/danielgindi/Charts/releases).
- Study the Android version's [**Documentation-Wiki**](https://github.com/PhilJay/MPAndroidChart/wiki)
- Study the (Still incomplete [](http://cocoadocs.org/docsets/Charts/)) [**Pod-Documentation**](http://cocoadocs.org/docsets/Charts/)
- Search or open questions on [**stackoverflow**](http://stackoverflow.com/questions/tagged/ios-charts) with the `ios-charts` tag
- Search [**known issues**](https://github.com/danielgindi/Charts/issues) for your problem (open and closed)
- Create new issues (please :fire: **search known issues before** :fire:, do not create duplicate issues)
Features
=======
**Core features:**
- 8 different chart types
- Scaling on both axes (with touch-gesture, axes separately or pinch-zoom)
- Dragging / Panning (with touch-gesture)
- Combined-Charts (line-, bar-, scatter-, candle-stick-, bubble-)
- Dual (separate) Axes
- Customizable Axes (both x- and y-axis)
- Highlighting values (with customizable popup-views)
- Save chart to camera-roll / export to PNG/JPEG
- Predefined color templates
- Legends (generated automatically, customizable)
- Animations (build up animations, on both x- and y-axis)
- Limit lines (providing additional information, maximums, ...)
- Fully customizable (paints, typefaces, legends, colors, background, gestures, dashed lines, ...)
- Plotting data directly from [**Realm.io**](https://realm.io) mobile database ([here](https://github.com/danielgindi/ChartsRealm))
**Chart types:**
*Screenshots are currently taken from the original repository, as they render exactly the same :-)*
- **LineChart (with legend, simple design)**

- **LineChart (with legend, simple design)**
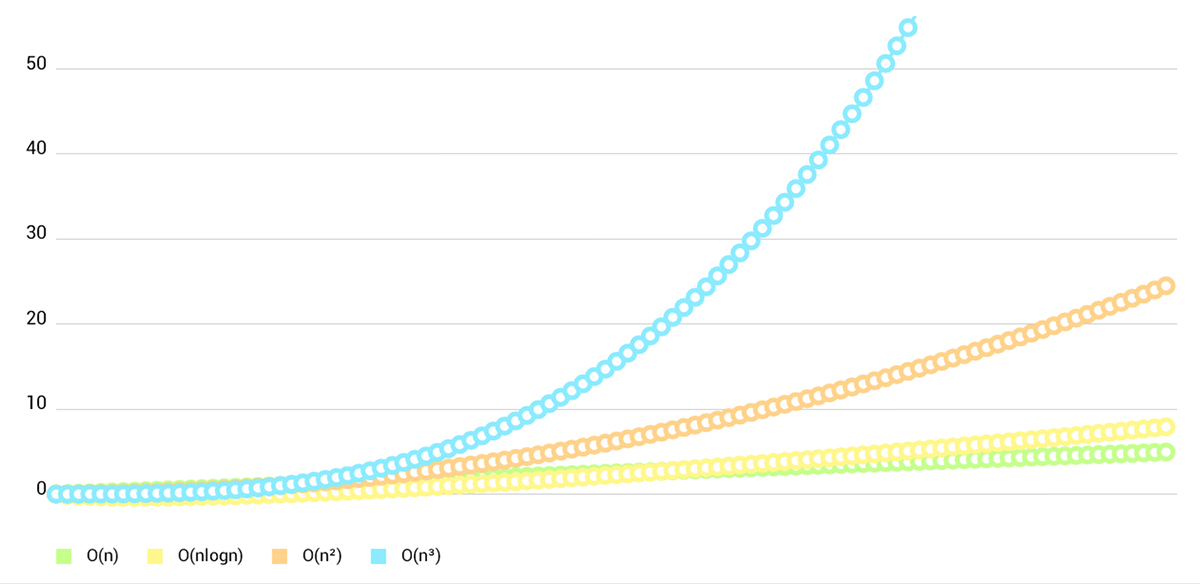
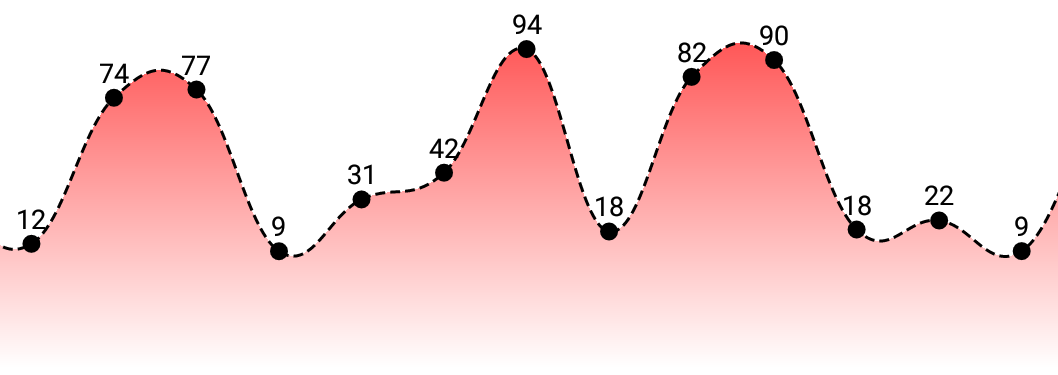
- **LineChart (cubic lines)**
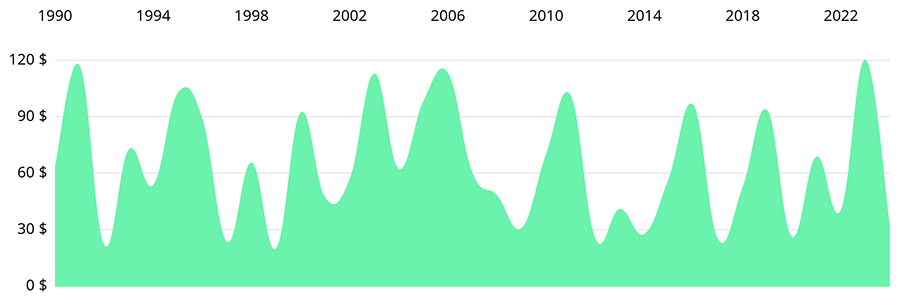
- **LineChart (gradient fill)**
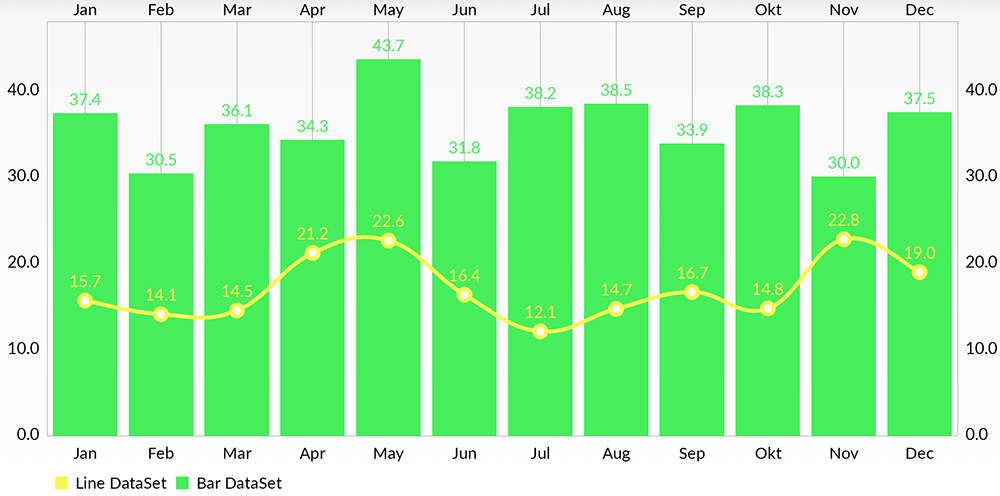
- **Combined-Chart (bar- and linechart in this case)**
- **BarChart (with legend, simple design)**

- **BarChart (grouped DataSets)**

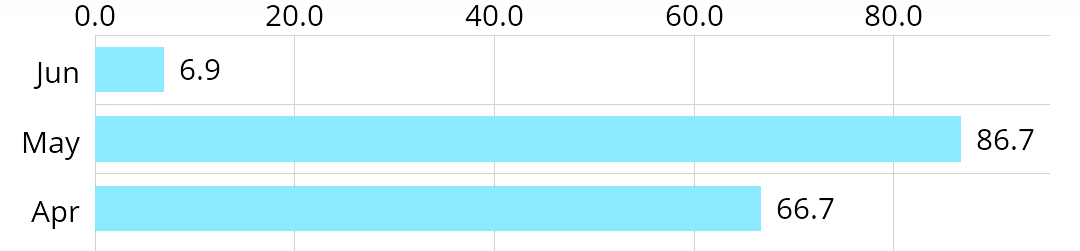
- **Horizontal-BarChart**
- **PieChart (with selection, ...)**

- **ScatterChart** (with squares, triangles, circles, ... and more)

- **CandleStickChart** (for financial data)

- **BubbleChart** (area covered by bubbles indicates the value)

- **RadarChart** (spider web chart)

Documentation
=======
Currently there's no need for documentation for the iOS/tvOS/macOS version, as the API is **95% the same** as on Android.
You can read the official [MPAndroidChart](https://github.com/PhilJay/MPAndroidChart) documentation here: [**Wiki**](https://github.com/PhilJay/MPAndroidChart/wiki)
Or you can see the Charts Demo project in both Objective-C and Swift ([**ChartsDemo-iOS**](https://github.com/danielgindi/Charts/tree/master/ChartsDemo-iOS), as well as macOS [**ChartsDemo-macOS**](https://github.com/danielgindi/Charts/tree/master/ChartsDemo-macOS)) and learn the how-tos from it.
Special Thanks
=======
Goes to [@liuxuan30](https://github.com/liuxuan30), [@petester42](https://github.com/petester42) and [@AlBirdie](https://github.com/AlBirdie) for new features, bugfixes, and lots and lots of involvement in our open-sourced community! You guys are a huge help to all of those coming here with questions and issues, and I couldn't respond to all of those without you.
### Our amazing sponsors
[Debricked](https://debricked.com/): Use open source securely
[](https://debricked.com/)
License
=======
Copyright 2016 Daniel Cohen Gindi & Philipp Jahoda
Licensed under the Apache License, Version 2.0 (the "License");
you may not use this file except in compliance with the License.
You may obtain a copy of the License at
http://www.apache.org/licenses/LICENSE-2.0
Unless required by applicable law or agreed to in writing, software
distributed under the License is distributed on an "AS IS" BASIS,
WITHOUT WARRANTIES OR CONDITIONS OF ANY KIND, either express or implied.
See the License for the specific language governing permissions and
limitations under the License.
|